Trends from Crunchbase Newsletters
I noticed that I had five years of Crunchbase newsletters, so I thought I’d mine them for trends. What does the 5-year wordcloud look like? Here you go!
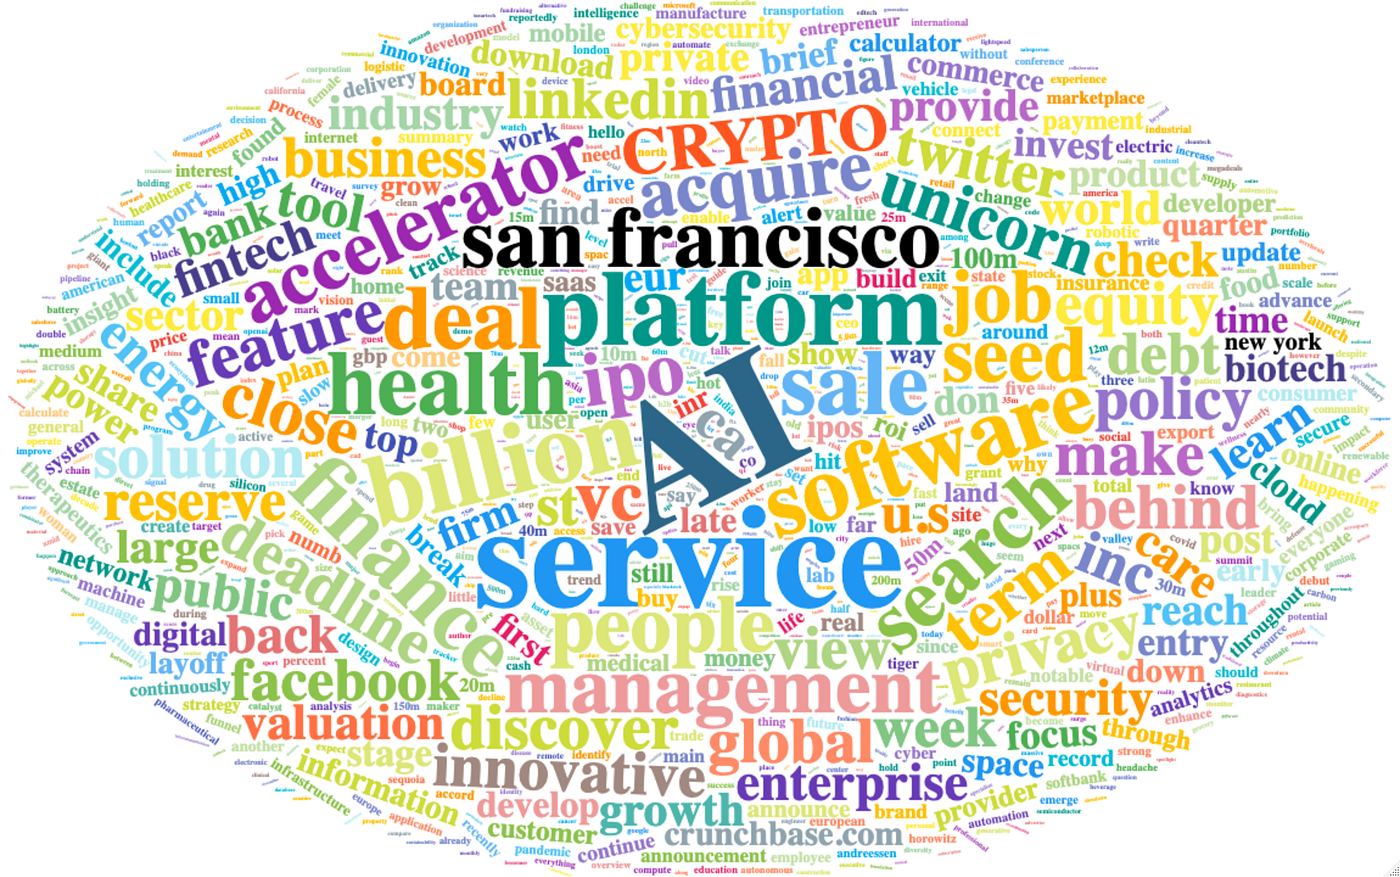
AI is big! Crypto is medium. Accelerators are in the news! Somebody seems to think San Francisco and is important. Interesting! So how did the discussion about AI and Crypto change over the years?
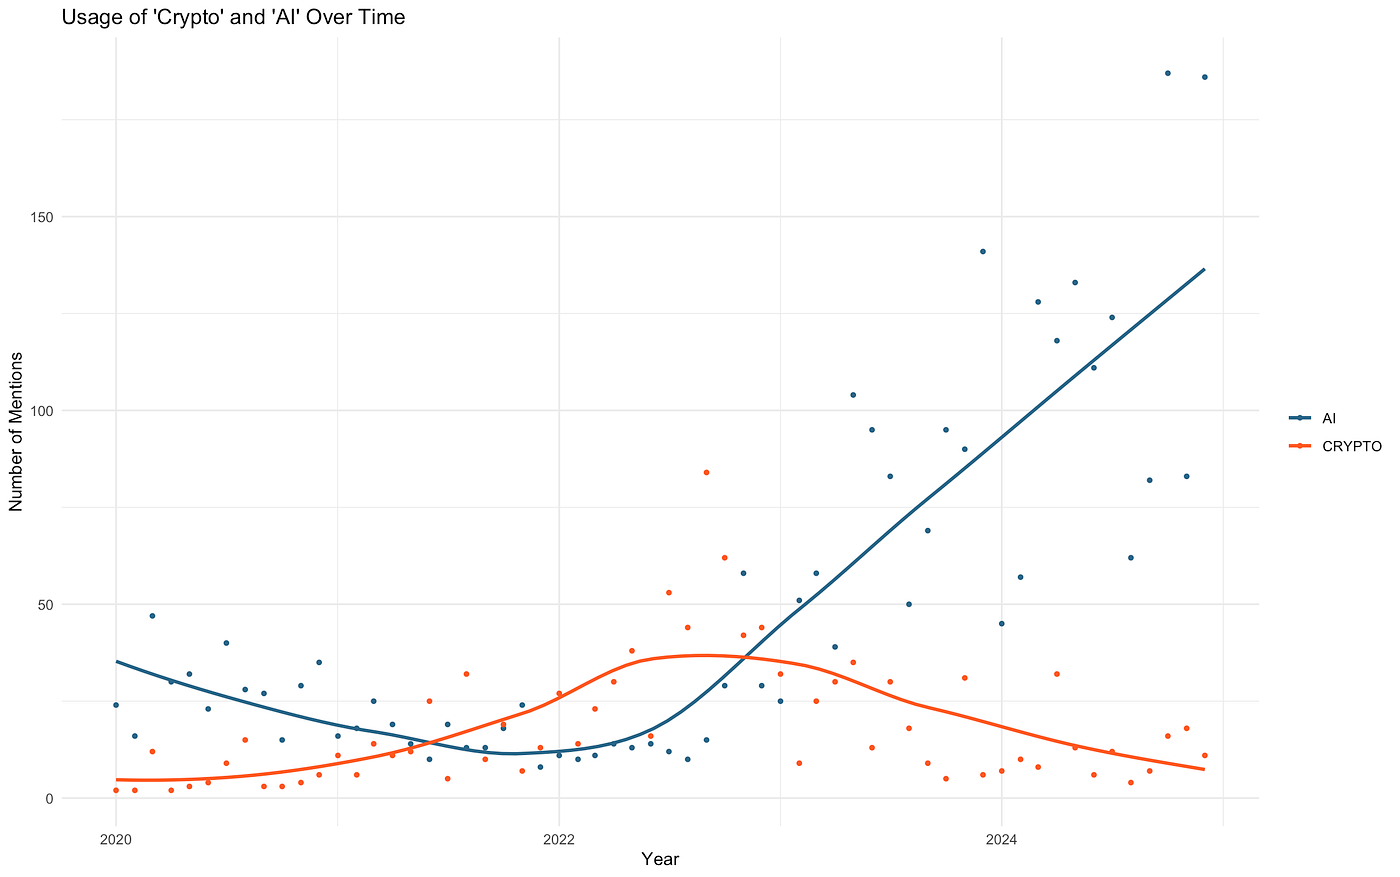
Not surprising that AI mentions accelerated dramatically over the past three years, while Crypto declined, though I’m not entirely certain what why crypto had so few mentions in the early data.
Focusing on the last three years, where the data seem more robust, let’s compare wordclouds.
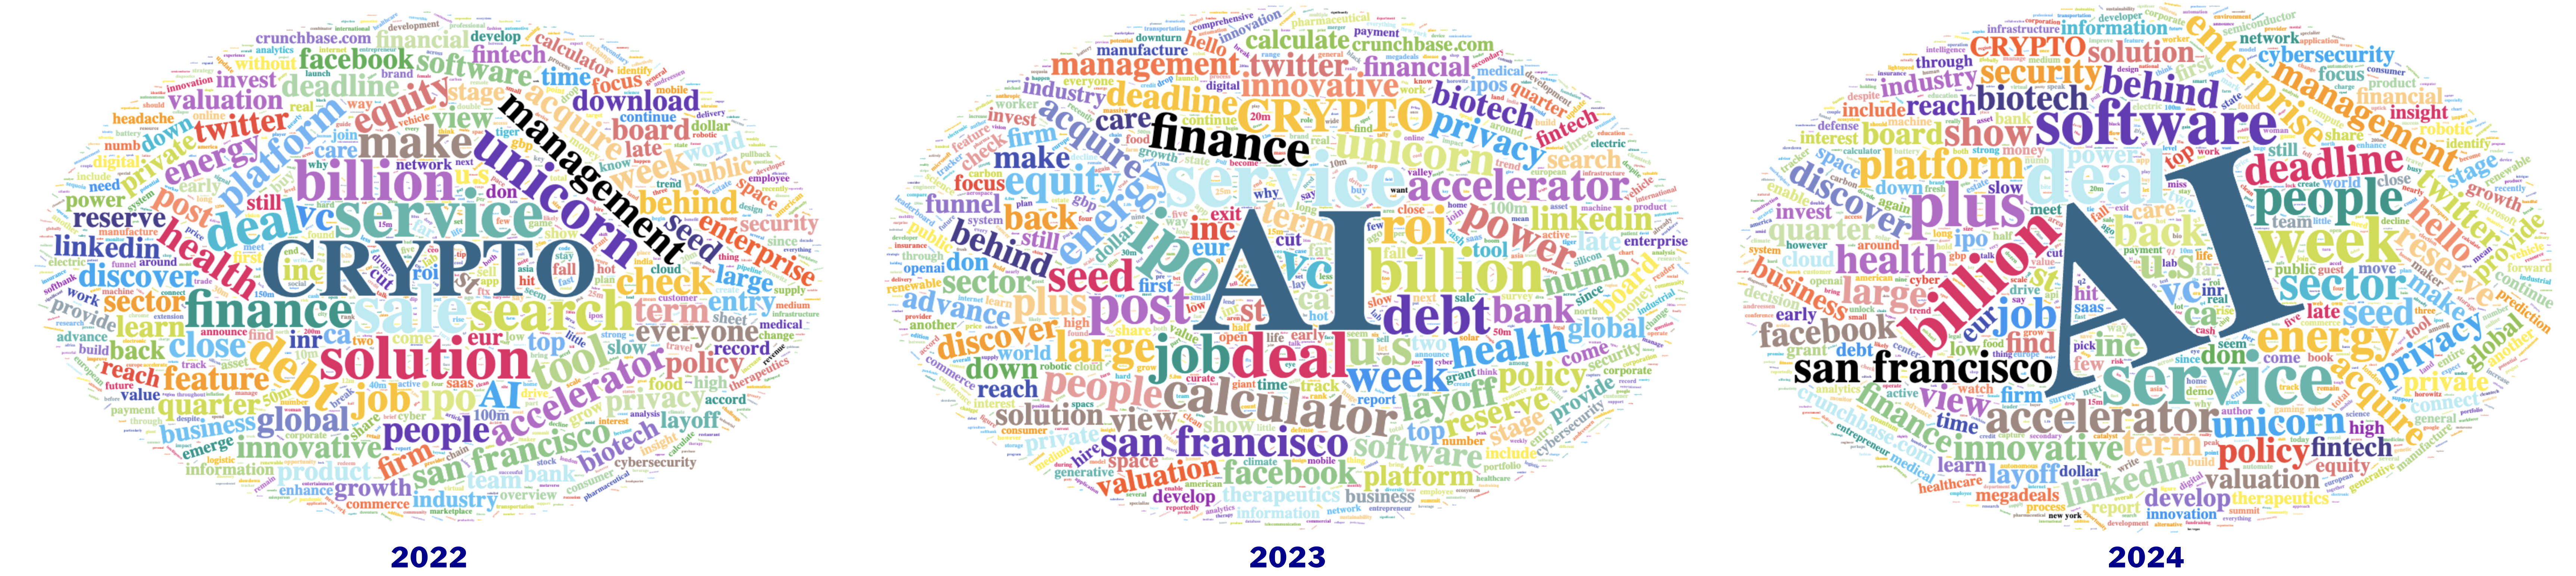
Yup! AI got big. Crypto got small. Note AI (in blue) hiding below the word ‘solution’ in 2022!
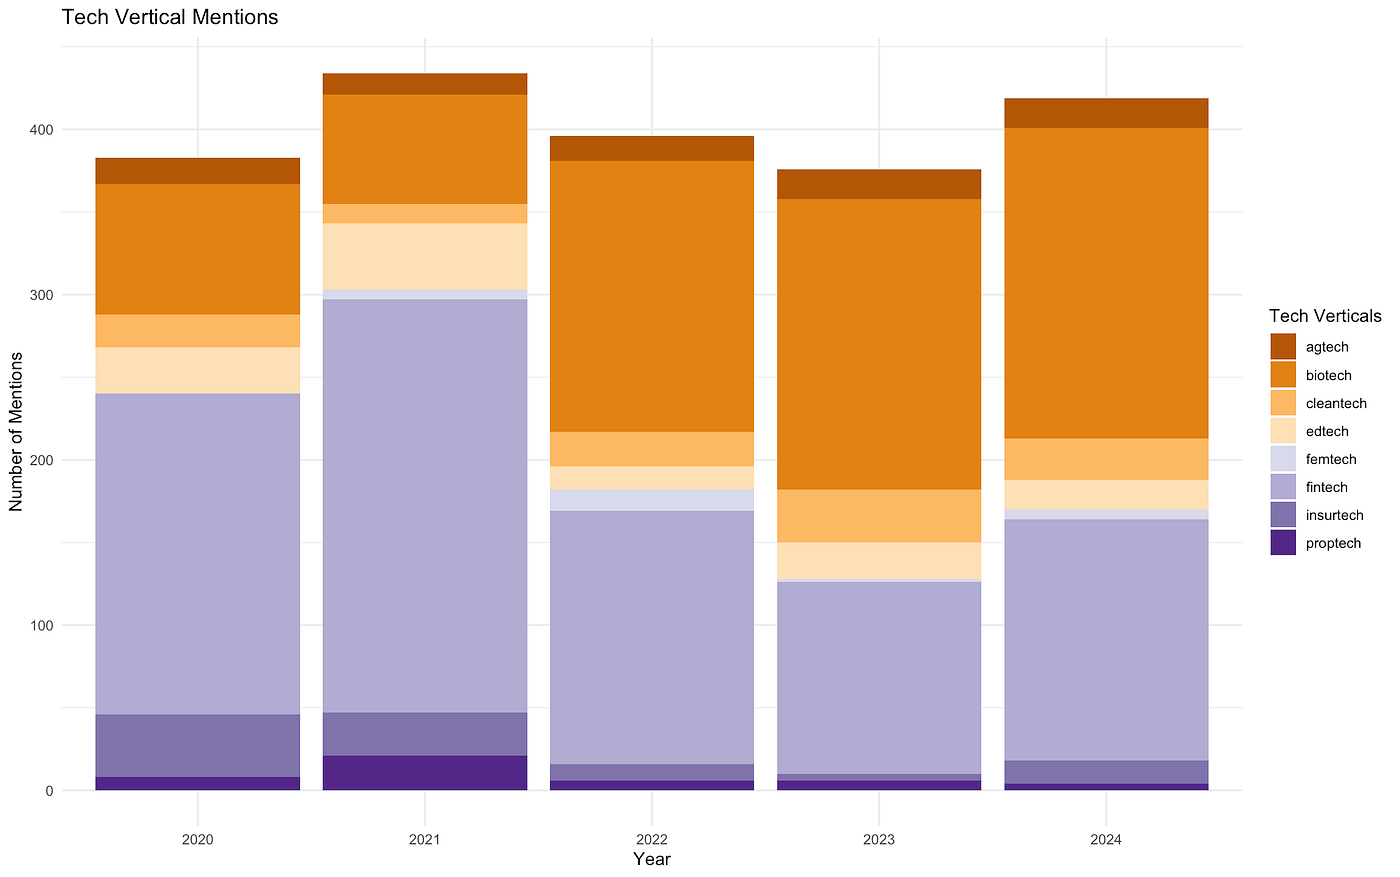
Tech Verticals
I was also curious about tech verticals. What’s hot? What’s not?
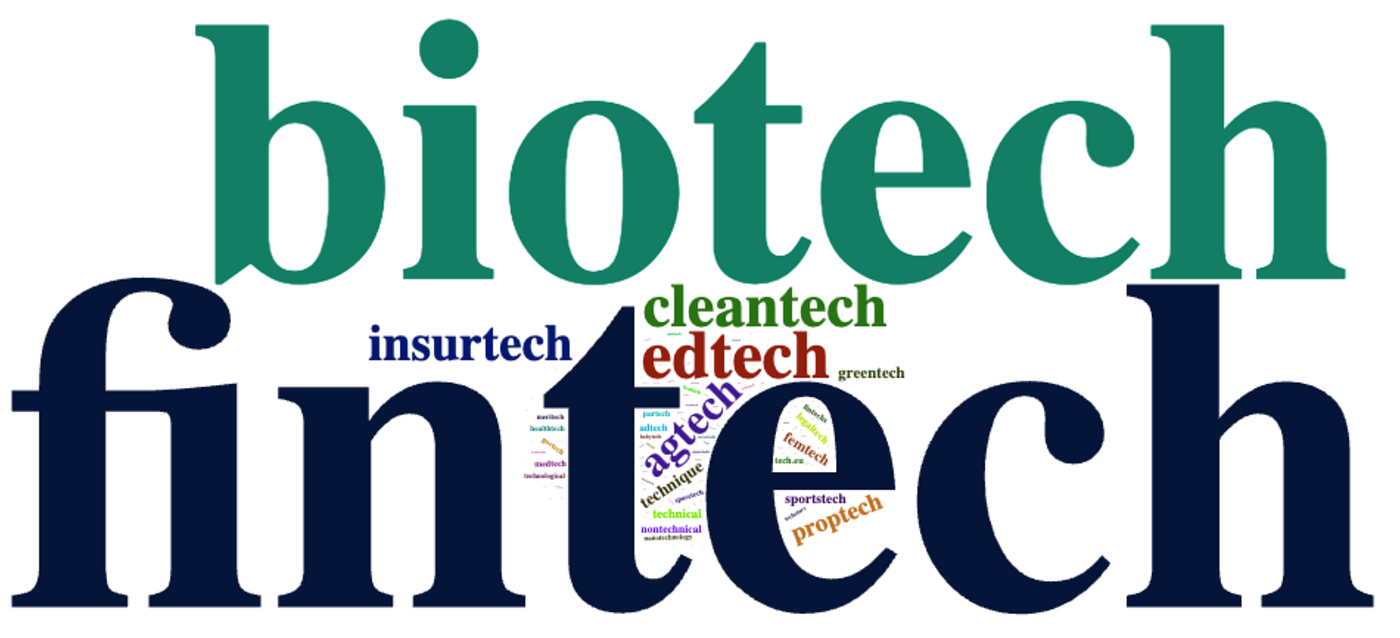
Fintech and biotech dominate! Edtech, cleantech, insuretech, agtech and proptech are on the charts. We can get some more detail on the top mentions with a bar chart.
Cities
Lastly, I wondered what cities are most cites as relevant to this ecosystem. I’m rooting for New York, but suspect there will be a west coast bias.
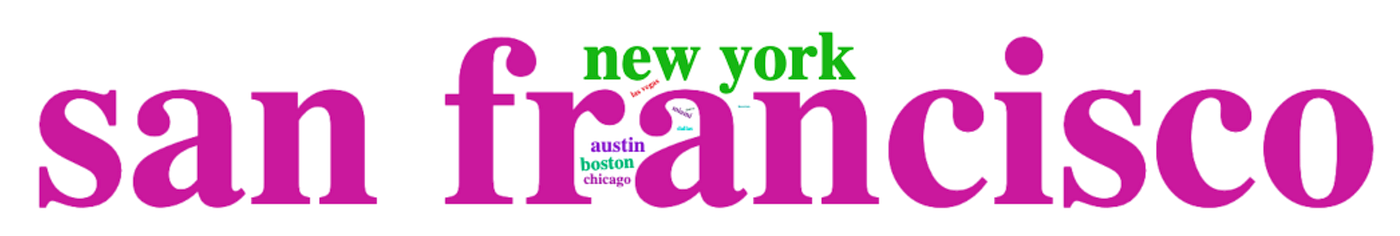
How does that break down?
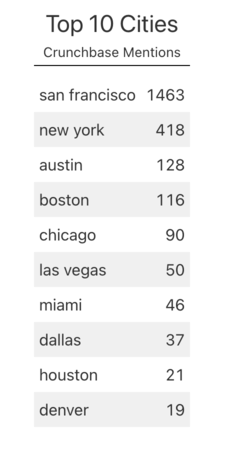
Sorry New York. 2nd place to San Francisco. Not surprising! And at least “we” beat Boston! :)
So are Crunchbase newsletters are a good proxy for “what’s going on” in the venture capital / entrepreneurship ecosystem? About that I can’t be sure. But there’s definitely some interesting data and trends to be found, and I’ll be sure to update this once 2026 rolls around and I’ve got another year of newsletters to… crunch!
Methodology
1,015 Crunchbase newsletters, common/boring words/numbers removed (e.g. “and”, “was”, “are”, “pending”, “deadlines”, etc.), the entire corpus lemmatized, common concepts collapsed (e.g. “crypto”, “web3” and “blockchain” collapsed to “crypto”) and alternate spellings merged. The data was processed in — as well as all graphs, charts and wordclouds create in — R.